Which type of public transport produces least Co2 emissions?
Thank you for the relevant question regarding the CO2 emissions of public transport!
To summarize the answer:
-
For long distance travelling in Finland, the InterCity train produces the least CO2 emissions.
-
For travelling inside a city in Finland, an electric bus would produce the least CO2 emissions. They are not yet widely available, so the next best options are biogas buses, local trains and the metro. If rail traffic is not available at all, buses should be as full as possible in order to minimize the CO2 emissions per passenger.
Long answer:
When we think about the CO2 emissions produced by public transport, four things need to be considered:
- The fuel / energy source used by the form of transport
- How much energy does the form of transport use per kilometre (energy consumption is affected by technology, speed, season, road conditions etc.)
- Utilization rate = how many people use the specific form of public transport
- Does the form of public transport cause emissions elsewhere? For example, do you need to drive by car to the train station? Does manufacturing the vehicle produce a lot of emissions? Does it take a lot of energy to build, operate and maintain the infrastructure (including lighting, heating, escalators etc.)?
Considering points 1-3, specific emission factors are defined for different transport modes. The emission factor tells us how much CO2 equivalent emissions (emissions contributing to global warming) are produced in grams per kilometre and per passenger. Point 4 is very difficult to estimate based on available information.
Those forms of public transport that have an internal combustion engine and use fossil fuels (buses operating on diesel or natural gas) produce direct carbon emissions. Trains, tram, metro and electric buses operate on electricity: they don’t have direct emissions, but they use electricity that needs to be produced. This means that they contribute to CO2 emissions indirectly, if the electricity is produced with something else than renewable energy.
Focusing on Finland, emission factors are defined for our total electricity production (141 kg CO2/MWh) and for electricity purchased from outside of Finland (164 kg CO2/MWh). 23% of total electricity consumption in Finland is imported. Metro, trams and local trains operate mainly in the capital region, so for them we can apply the emission factor of Helen (139 g CO2/kWh in 2019).
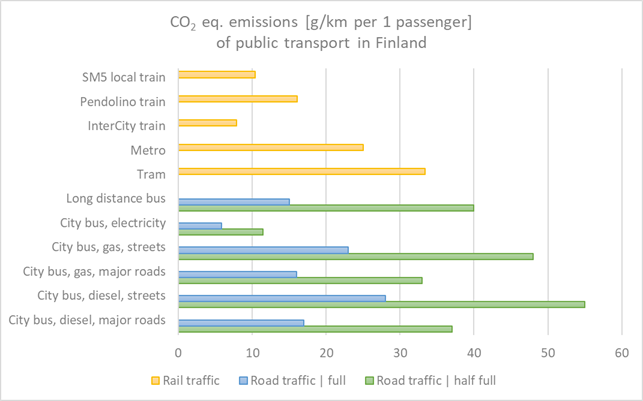
If we assume that 1 person needs to be moved for 1 kilometre, we can compare different forms of public transportation (please see the graph below).
This comparison is based on emission factors for Finland. For long distance trains (InterCity and Pendolino) we apply the average emission factors, although VR Group reports that 95% of their trains operate on purchased electricity that has been produced by hydropower.

For buses, there is a big difference in the CO2 -eq. emissions per km and per passenger depending on the utilization rate. If the bus is full of passengers, emissions per km and person are clearly smaller than when it is only half full. It is also more efficient to travel by bus on major roads (e.g. ring roads in Helsinki) as compared to smaller streets with continuous stops: this shows in the emissions.
Buses operating on gas produce less CO2 -eq. emissions than those operating on diesel. Both natural gas and biogas produce emissions, but natural gas is a fossil fuel and thus contributes to the accumulation of CO2 in the air. For biogas, the CO2 -eq. emissions are often at least 80% smaller than for fossil fuels, but it depends highly on the ingredients (is it mostly produced from e.g. domestic bio waste, imported bio waste or manure).
Trams consume electricity and thus have indirect emissions. If buses are full of passengers, they produce less CO2 emissions per km and passenger than the tram in current circumstances in Finland, whereas a half-full bus produces more. If the electricity production develops to be less carbon intensive, the indirect CO2 emissions of all rail traffic decrease.
An advantage of rail traffic as compared to electric buses is lower manufacture emissions: the production of components and batteries needed for an electric bus requires a lot of energy. In general, the lifecycle perspective complicates the comparison. For example, manufacturing an electric bus produces approximately 10% more emissions than manufacturing a diesel bus.
Related to emissions, here is another interesting way to compare the efficiency of different forms of transportation: how far can one person get with different traffic modes and 1 kWh of energy? With an average car 1,3 km, by bus approximately 2,5 km, by tram 4,4 km, by metro 10 km and by local train 30 km (comparison by HSL).
Sources:
Emission factors of national electricity production and imported electricity:
Statistics Finland - Suomen virallinen tilasto (SVT): Sähkön ja lämmön tuotanto [verkkojulkaisu]. ISSN=1798-5072. Helsinki: Tilastokeskus [viitattu: 16.12.2020]. http://www.stat.fi/til/salatuo/index.html
Statistics Finland - Suomen virallinen tilasto (SVT): Energian hankinta ja kulutus [verkkojulkaisu]. ISSN=1799-795X. Helsinki: Tilastokeskus [viitattu: 16.12.2020]. http://www.stat.fi/til/ehk/tau.html
Emission factors and electricity consumption values of different fuels and modes of transport:
Teknologian tutkimuskeskus VTT Oy, LIPASTO yksikköpäästöt -tietokanta. http://lipasto.vtt.fi/en/index.htm
Specific emission factor for electricity sold by Helen:
https://www.helen.fi/helen-oy/energia/energiantuotanto/sahkon-ja-lammon-ominaispaastot
Electricity used by VR:
Electric buses:
Zhou, B., Wu, Y., Zhou, B., Wang, R., Ke, W., Zhang, S., & Hao, J. (2016). Real-world performance of battery electric buses and their life-cycle benefits with respect to energy consumption and carbon dioxide emissions. Energy , 96 , 603-613.
Schwertner, M., & Weidmann, U. (2016). Comparison of Well-to-Wheel Efficiencies for Different Drivetrain Configurations of Transit Buses. Transportation Research Record , 2539 (1), 55-64.
Chester, M., & Horvath, A. (2009). Life-cycle energy and emissions inventories for motorcycles, diesel automobiles, school buses, electric buses, Chicago rail, and New York City rail.

